The idea of buying stocks that are cheap and holding on as they appreciate in value over time is well aligned with the simple heuristic “buy low and sell high.” This central concept has created, for myself, a natural and intuitive pull towards value investing. The problem is that not all “cheap” stocks eventually go on to appreciate in value. Some are cheap for a reason–they have poor prospects and will likely end up in Wall Street’s corporate boneyard.
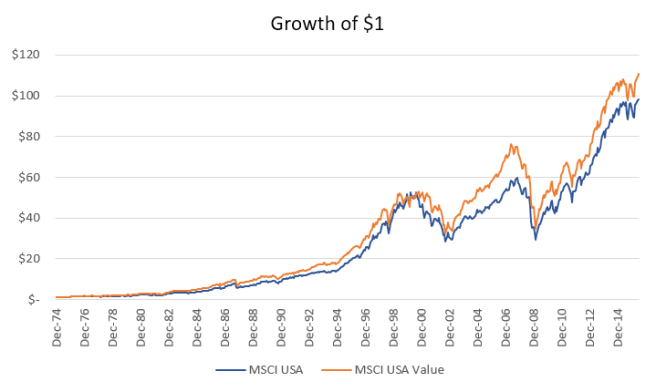
Without knowing which stocks will succeed or fail it would seem to make sense to diversify among a collection of value stocks. One such way of doing this is through a value index, but there’s a caveat that needs to be understood when it comes to the performance of these indexes. The performance of the MSCI indexes below demonstrates the issue
| Index Performance (Jan 1975 – Jun 2016) | ||
| Annualized Return |
Volatility (Std Dev) |
|
| Domestic | ||
| MSCI USA | 11.7% | 15.0% |
| MSCI USA Value | 12.0% | 14.7% |
| Foreign | ||
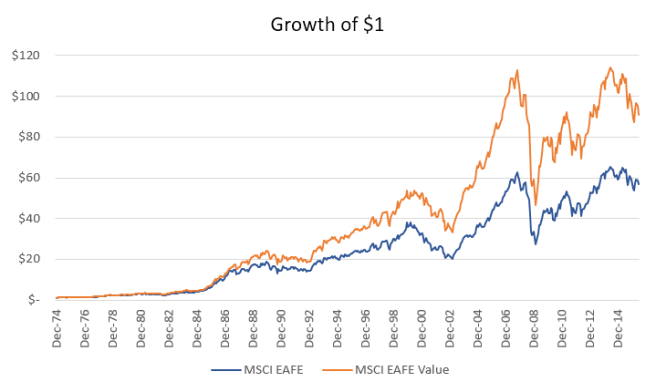
| MSCI EAFE | 10.2% | 17.2% |
| MSCI EAFE Value | 11.5% | 17.4% |
While the EAFE value did produce a meaningful return premium compared to the baseline EAFE, the USA value index barely managed. The data above would appear to be contradictory–that value indexes may provide a premium in one market but not in another. It opens up the possibility that a value index may not return a premium, or one that is only slight. The situation is only more dire when actual funds are considered.
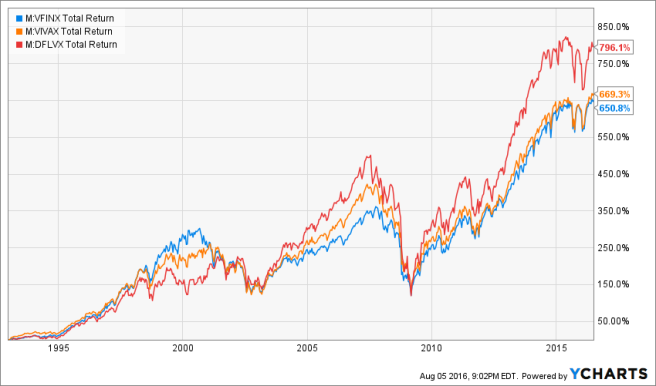
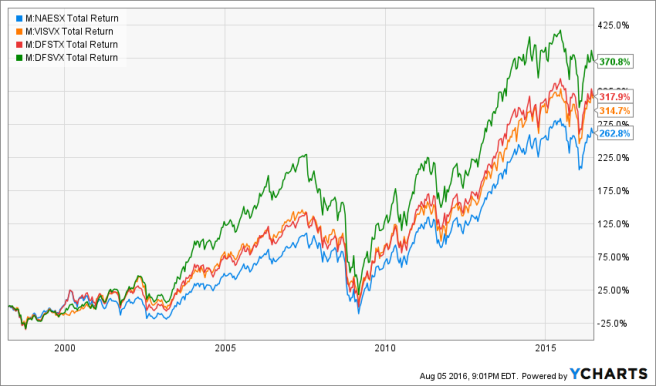
| Index Fund Performance | ||
| Cumulative Return |
Annualized Return |
|
| Large Cap (Jan 1993 – Jun 2016) | ||
| Vanguard 500 | 650.8% | 9.0% |
| Vanguard Value | 669.3% | 9.1% |
| DFA Large Cap Value | 796.1% | 9.8% |
| Small Cap (Apr 1998 – Jun 2016) | ||
| Vanguard Small Cap | 262.8% | 7.3% |
| Vanguard Small Cap Value | 314.7% | 8.1% |
| DFA Small Cap | 317.9% | 8.2% |
| DFA Small Cap Value | 370.8% | 8.9% |
While the Vanguard small cap value fund did produce a premium compared to the broader small cap fund, the large cap value fund did not. Note that the above data covers a fairly broad range of time–several decades in fact–over which one would expect to see some sort of meaningful premium. Again, the implication here is that value investing by way of a value index may work, but it may not. The mere fact that it hasn’t worked in a few situations over very long periods of time is reason enough for me to call the idea into question. Under the worst conditions an investor who holds such a fund may be paying more to access a fund labeled “value” that ends up performing very similar to the parent index. Wes Gray examined the returns of a deep value portfolio over the past 2 years and provided some insight in a recent article for Forbes
If the Vanguard value fund was delivering a deep value exposure, its performance should roughly match the deep value index. It does not. Rather, it resembles the S&P 500. And to be fair, Vanguard doesn’t make a claim that they are delivering a deep value exposure. Vanguard’s Head of ETF Product Management, Rich Powers, states that the underlying index behind VTV “is in no way meant to portray the deep value universe, which is smaller in number and has a different return/volatility profile.” [1]
The Vanguard Value Trust does indeed have quite a few holdings, 318 as of this writing. The DFA Large Value Fund has a similar count at 305; numbers that don’t exactly scream “concentrated.” Some care should be taken here. The DFA fund has historically produced an annualized premium of 0.8% over the Vanguard 500 fund going back to 1993, and it doesn’t appear to be due to a higher degree of concentration. DFA, being that they don’t run index funds, takes certain liberties that enable their funds to generate a premium over the long-term. They’re active managers using internally developed techniques around selection and transaction that generate a premium–call them “index-ish.” [2]
For any given value index the most important consideration is the methodology used to determine “cheapness.” Fama and French famously popularized use of the book-to-market (the inverse of price-to-book) ratio to sort stocks into value and growth categories. [3] MSCI currently uses three parameters for their value sort including book-to-price ratio, dividend yield and the 12-month forward earnings-to-price ratio. [4] Not to be outdone, the CRSP recipe tacks on sales-to-price and historic earnings-to-price for a total of five parameters. [5] Other index constructions from major providers such as S&P Dow Jones, and FTSE/Russell appear to use the same factors with slightly different formulations. [6,7] Do the ratios used in a given formulation impact returns, or are they more or less getting at the same thing?
Wes Gray and co-author Tobias Carlisle answer this question in Quantitative Value. Their work reveals that sorting value stocks based on the EBIT-to-TEV ratio produced the best historical returns when compared to other valuation ratios. The two also explored look-back periods of various lengths (2 years to 8 years) and sorts using combinations of various ratios, finding no consistent meaningful advantage over the one year EBIT-to-TEV. In an ironic twist of fate, the worst valuation metric was the forward looking earnings-to-price ratio, which appears in several of the major index methodologies previously mentioned.
The EBIT-to-TEV ratio has been previously used as a metric to identify attractively priced stocks by Joel Greenblatt as part of his magic formula. The motivation behind this ratio is to account for capital structure and compare companies on a more equal standard. EBIT stands as a measure of earnings that ignores capital structure and acts as a gauge of earnings from operations (operating profit). Total Enterprise Value (TEV) is essentially the price to purchase the entire company taking into account equity, debt, and preferred shares (those with smaller amounts of debt and preferred shares will have a higher EBIT-to-TEV ratio).
TEV = market cap + debt + preferred shares + minority interests – excess cash
With a better handle on sorting cheap from expensive Quantitative Value breaks from the traditional methodologies that are limited to valuation ratios. Gray and Carlisle expand on Greenblatt’s magic formula in appraising Warren Buffett’s mantra of buying a “wonderful company at a fair price.” They seek companies that are not only cheap, but of a higher quality and therefore likely to provide higher returns in the future. Unlike the straightforward EBIT-to-TEV ratio the task of quantifying what a “wonderful company” looks like is a bit trickier.
Searching for quality can certainly sound subjective, but an easy place to start is to identify those companies which are clearly of low quality. Awareness and elimination of companies that have a high probability for fraud, earnings manipulation, or are experiencing financial distress helps shrink the pool of investable options. The authors present several measures based on accruals and the probability of manipulation. They include some fantastic examples of Enron and WorldCom that demonstrate the implementation of their formulations.
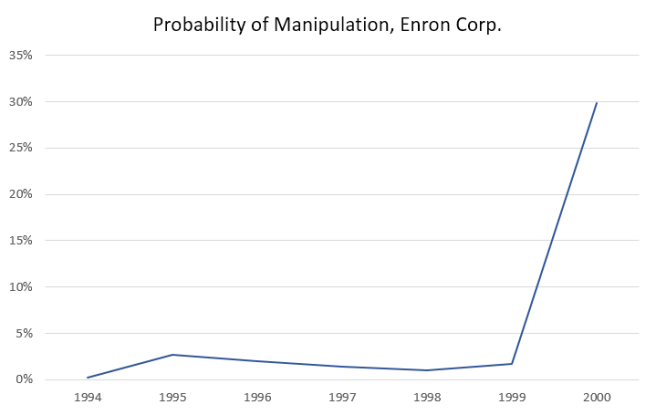
As many value investors have learned the hard way, the further down the income statement an accounting number appears, the less reliable the number becomes. [8b]
The end result is a portfolio that is substantially more concentrated than the Vanguard Value Trust or DFA Large Value Fund. The Quantitative Value Fund (QVAL) currently holds about 40 stocks compared to the 300+ in the former funds. Broadly speaking the DFA funds and the Quantitative Value fund demonstrate something that is very important. If you want to earn a true premium you will likely have to be doing something different from everybody else. Furthermore, it may not be comfortable, easily accessible or cheap.
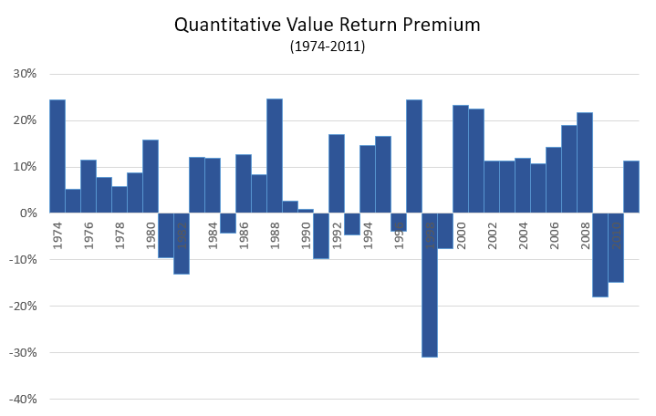
All said, the strategy appears to have weathered fairly well. From 1974 through 2011 it provided a premium in 28 of the full 38 years. It massively under performed during the tail end of the dot-com bubble when growth stocks were all the rage. A very similar result to what Buffett and Berkshire experienced during the same time.
If you’re drawn towards value investing this is an insightful read.
1. Gray, Wesley. Want to spot a true Value Investor? Look for horrible recent performance. Forbes. August 5, 2016. http://www.forbes.com/sites/wesleygray/2016/08/05/searching-for-deep-value-exposure-look-for-horrible-recent-performance/2/#1aed42167ad7.
2. DFA Process/Engineering. https://us.dimensional.com/process/engineering.aspx.
3. Fama, Eugene F. and Kenneth R. French. The Cross-Section of Expected Stock Returns. The Journal of Finance. Vol. 47, No. 2 (Jun., 1992), pp. 427-465. http://www.jstor.org/stable/2329112.
4. MSCI Global Investable Markets Value and Growth Index Methodology. https://www.msci.com/eqb/methodology/meth_docs/MSCI_Dec07_GIMIVGMethod.pdf. p. 9
5. CRSP U.S. Equity Indexes Methodology Guide. http://www.crsp.com/files/Equity-Indexes-Methodology-Guide_0.pdf. p. 50
6. S&P U.S. Style Indices Methodology. http://us.spindices.com/documents/methodologies/methodology-sp-us-style.pdf. p. 7
7. Russell U.S. Equity Indexes. http://www.ftse.com/products/downloads/Russell-US-indexes.pdf?32. p. 25
8. Gray, Wesley and Tobias E. Carlisle. Quantitative Value. John Wiley & Sons, Inc. Hoboken, NJ. 2013.
(a) p. 79
(b) p. 100
(c) p. 234
NOTES – Quantitative Value.pdf
What I’m Reading
Economists Give Up on Milton Friedman’s Biggest Idea (Noah Smith)
The Roving Cavaliers of Credit (Steve Keen)
The Basics of Banking (Cullen Roche)
podcast: Masters in Business: Daniel Kahneman (Barry Ritholtz)
What If Factors Rarely Matter? (EconomPic)
The Price of Prestige (Lawrence Hamtil)
Evidence is Not Enough (Robert Seawright)
